
BIA forecasts that Facebook will generate a total of $8.3 billion in overall 2020 ad spending. Over 90 percent of Facebook ad revenue is from mobile advertising. However, in this political season, it is Facebook’s political advertising that has developed outsized attention and influence because of its unique role as a social media platform.
A new political advertising database tool provides transparency into who is buying ads in Facebook. The service is the NYU Ad Observatory and is one of the programs developed by NYU’s Online Political Transparency Project. The Facebook Ad Observatory – developed by the NYU Tandon School of Engineering in association with GW’s Institute for Data, Democracy & Politics (IDDP) – will increase social media ad transparency ahead of the 2020 elections.
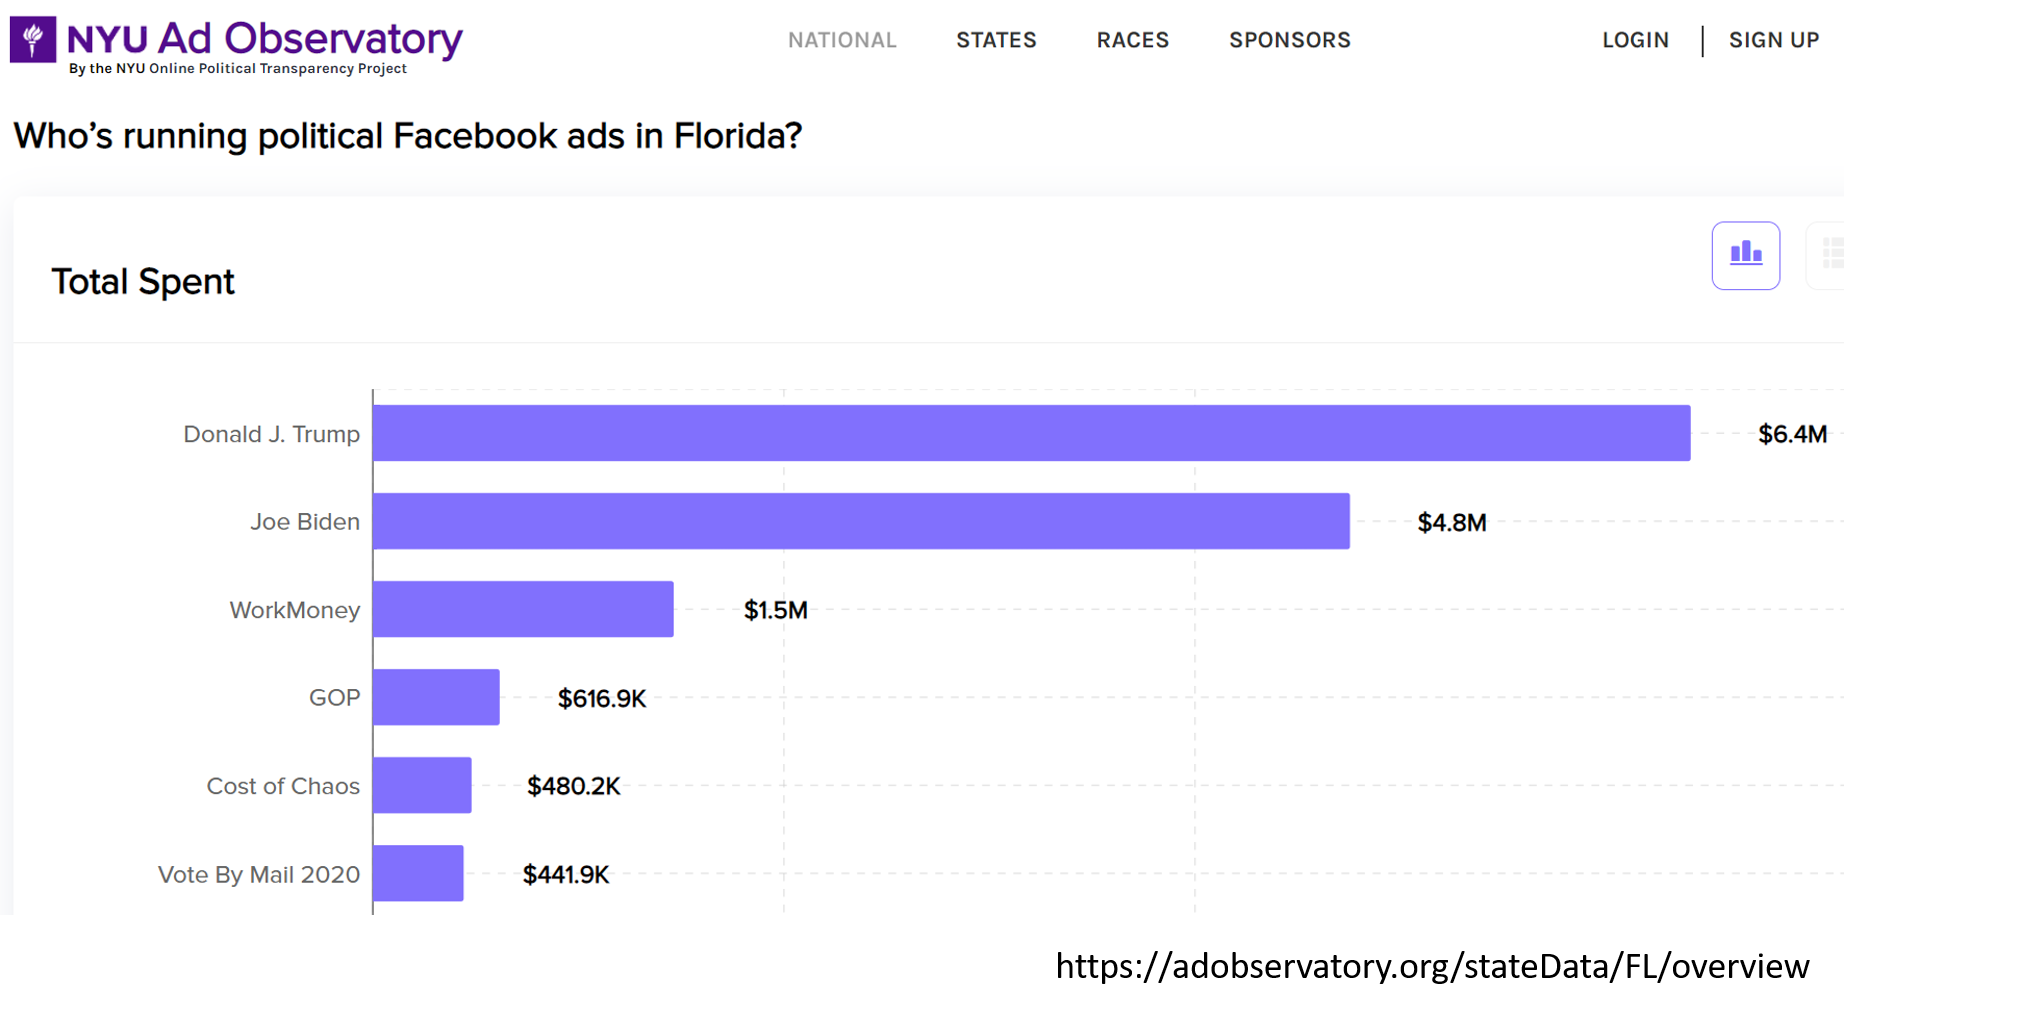
The tool analyzes underlying data to answer several questions about National and State campaigns:
- Who’s running political Facebook ads?
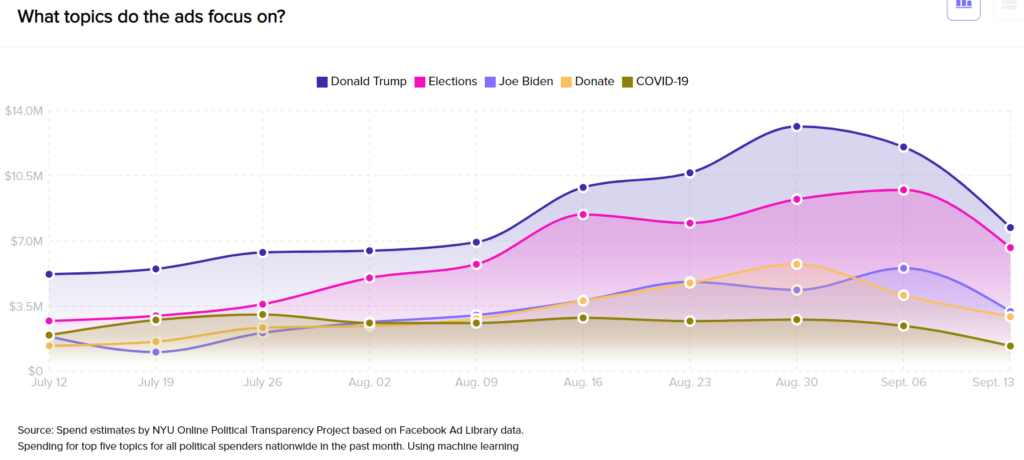
- What topics do the ads focus on?
- How much was spent by whom?
- Data is provided for individual campaigns and sponsors
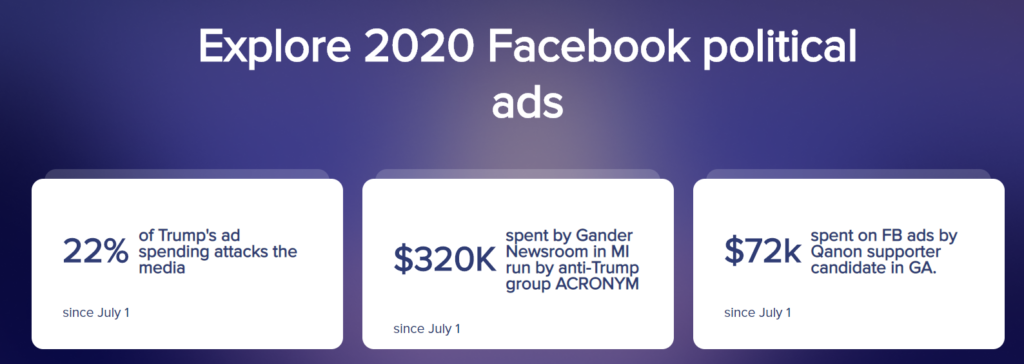
For example, the Facebook Ad Observatory can show the types of analytics highlighted below. Data can be displayed in visualizations or in tables.
The Online Political Transparency Project holds itself out as a, “nonpartisan, independent project focused on improving the transparency of online political advertising.” Its purpose is to build tools to collect and archive political advertising data, and makes these available publicly.
BIA will keep an eye on this project and report on findings. As social media continues to dominate in terms of eye balls and engagement with consumers, tracking programs such as this one will be critical to provide transparency into origins of content.
To track political spending by local markets, we are also updating our political ad forecast and will release an updated version the week of Sept. 21. More to come soon.
This Post Has 0 Comments