
Local media executives already are or soon will be headed into budgeting season. CEOs, CROs, and CFOs will be working with executives at their various business units to develop top-level views of advertising expectations and other secular and cyclical industry trends. These top level views derive from incorporating deeper analytics and insights based on trends in their regions and local markets that need to roll up into a corporate level view. At BIA Advisory Services, we’ve already started working with clients on their 2019 forecasting and budgeting.
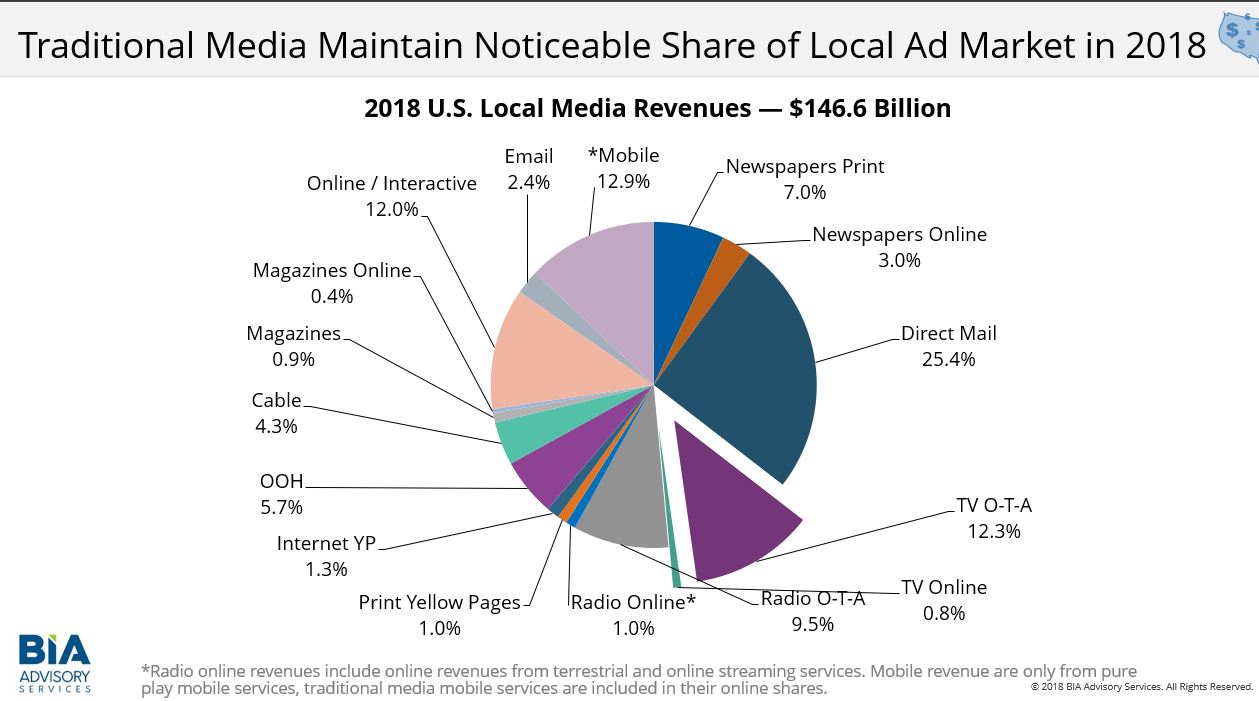
In the chart above, you’ll see BIA’s forecast for where total U.S. ad spending targeting local audiences will end up. We’re sizing the 2018 market at $146.6 billion. What will this pie chart show for the 2019 total spend and for the “share of wallet” among the different media platforms? How will individual media companies perform in their own verticals at the local market level? We spend a lot of time on these questions and in fact designed our BIA ADVantage local market intelligence platform to be a core resource for our clients as they tackle these questions.
Here are some of the key inputs and processes we recommend that our clients incorporate into developing their budget scenarios:
- Objective and informed third-party insights into key headwinds and tailwinds that will impact your revenue opportunities, and strategies for addressing these trends. Trade and general press, industry conferences, input from advisers, and internal strategy sessions will help develop grounded views. BIA has two upcoming Local Impact conferences that are designed to help inform participants about these kinds of market trends and ad forecasts. We also have a regular series of complimentary educational webinars, including one tomorrow on Advanced TV. Check you calendars to see if you’ll be able to join us at any of these events. Be sure to focus on data and externally validated trends, not just the, “what I’m hearing on the street is . . .” There may be a place for these more subjective and qualitative inputs when making fine-tuning judgments, but build baseline scenarios with input that is as objective and empirical as possible.
- Visibility into ad spend trends by media platform and business category from local market ad forecasts so you can see where the share of wallet is now and where it’s heading. Each media company will be juggling several views of where the local ad market is headed. At the corporate level, executives develop budget scenarios based on revenue growth and margin goals. In the operating units, perhaps at the regional and market levels, media companies will review past sales performance, and weigh relevant input factors such as pipelines, close rates and sales cycles by account verticals. These data can be combined with forecast revenue growth and implied paid media ad spending by different client business verticals. Of course, we know that different types of businesses invest in advertising with varying percentages of their revenues and at different times of year. All this has to be factored in.
- Benchmark market data to compare and contrast with your own data and market intelligence to develop your own more informed and unique sense of local market dynamics. Once media firms have established a “top-down” corporate budget plan, and the operating units have built a “bottom-up” budget plan, there comes that moment of reconciliation as inevitably the two views are discrepant. The key is to establish some measure of truth for understanding baseline revenue trends in local market ad spending. Forecasting local market advertising trends accurately requires incorporating lots of different data inputs, establishing validated model parameters, and developing the data science practices to build and test forecast models. Firms like BIA Advisory Services specialize in this type of local market ad forecasting. As our clients know, our local market intelligence platform BIA ADVantage provides very detailed local market ad forecasts. We also incorporate into that platform BIA’s Local Commerce Monitor, a survey of local advertisers, offering additional insights into the buy-side psychology and expected spending in the year ahead.
- Strategic inputs and data to help executives make judgments about growth rates, prioritizing ad spending by business categories, identify growth opportunities and competitive threats from other ad platforms. Finally, the actual budget requires judgment to weigh all inputs and make final decisions. This includes assessing risk versus opportunity, determining how much and what kind of information is enough to make budgetary decisions when you know you’ll never get perfect or complete inputs, and identify leading market indicators and milestones that provide validation points or signs that a course correction is needed. By identifying business verticals where ad spending is expected to grow disproportionately, it makes sense to prioritize sales teams to act on these opportunities and set revenue expectations accordingly.
Good luck with your budgeting for 2019. No one’s perfect at this, but it’s always important to make the best possible efforts and build in check-points for seeing when changes are necessary. Let us know if we can help. And of course, we hope to have you join our webinars and industry conferences to help you make better informed decisions.
This Post Has 0 Comments