

Mobile data continue to pelt us. This is a good thing, as ad networks (with promotional intent) release the data they’re seeing for ad placement. See, Millennial, JiWire, Jumptap, et al.
I usually internalize these data but don’t write about them here because doing so would be a full-time job (kind of like daily email has become). And they get plenty of coverage elsewhere.
The story seems to always be the same: Android and iOS grow in impression share, BlackBerry declines, Windows Phone7 is the little train that could, and Nokia is a rounding error (U.S.).
The Android story is the headline in most cases, and rightly so: Its open framework (and price tag) have compelled many global ODMs and carriers to adopt it, vs. Apple’s vertically integrated setup.
These data always have to be taken with a little caution, as they only measure activity on one network. They’re representative of market trends (directionally) but not a mirror image of the overall market.
But they’re still interesting and telling of where things are going. And in their defense, the same story is told by the Nielsens and comScores of the world. The latter released data just yesterday similarly showing Android’s share dominance (40.1 percent).
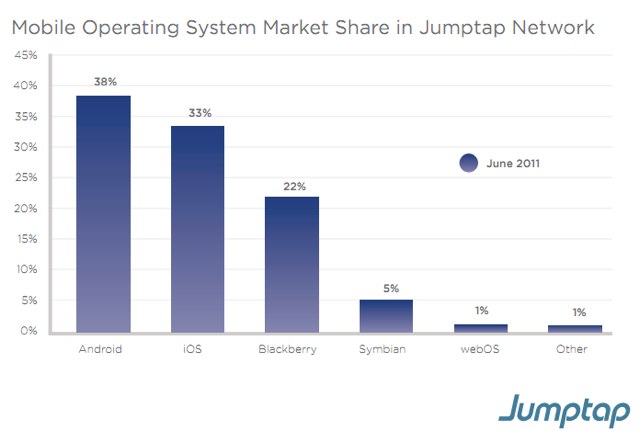
The latest mobile ad network to release data has been Jumptap, one of the largest remaining independent networks. There are some interesting breakdowns, as each of these ad network reports tend to do, as a hook.
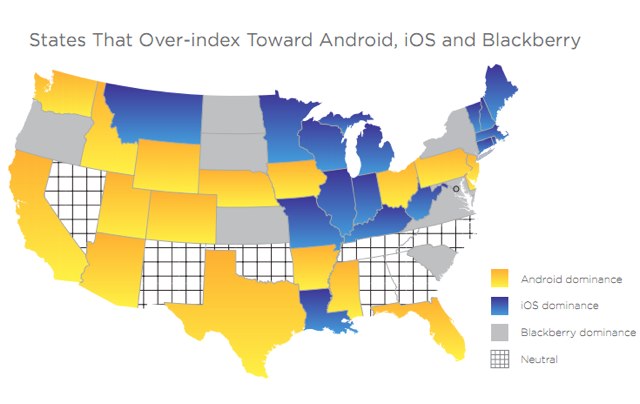
The highlights are a state-by-state breakdown of mobile OS share, reminiscent of a map of partisan leanings. But more interesting — and rare for these reports — is a breakdown of actual ad performance.
Specifically, clickthrough rates across mobile OSs are pitted against each other. IOS has a commanding lead with 0.78 percent, followed by Symbian with 0.50 percent and Android with 0.47 percent. The average across the board is 0.52 percent.

These are valuable data for forecasting and are also, once again, supportive of mobile ad performance overall. Compare with average online CTRs, which are are about 0.05 percent — a 10x difference.
But the real takeway is that quantity doesn’t always equal quality. The market share leader Android comes in third place for CTRs, while the plummeting Symbian comes in second.
Apple perhaps has the best of both worlds with the second-highest market share and the highest ad performance occurring on its operating system (not to be confused with its own ad network iAd).
Meanwhile, its share is expected to rise with the iPhone 5, rumored additional carriers coming on board, and Android’s slowed growth over the past few quarters. And its profits continue to jump through the roof.
This Post Has One Comment
Leave a Reply
You must be logged in to post a comment.
Wow! Android is really making its name now. 🙂
I’m glad I own an android smartphone.