
A few weeks back, in an Advisory, we released the following chart of the “Quarterly Revenue Index.” The Advisory was released the day after we got the final Q2 number filings from the different media groups. Our idea was to look holistically across a few ad segments, and make some comparisons about where we are and where we’re going.
It seems appropriate to revisit this comparison, given some of the dialogue I’ve recently seen in print and online. Everyone knows the ad market has been bad. The more interesting question is whether we have entered a fundamental shift in spending behavior. For some time, I have been telling people that we will see a change in advertiser spending patterns. The change in spending will be driven by de-leverage or debt financing (mortgage refinancing, etc.) coming to an end. No more easy money.
In local, a specific example might be a kitchen remodeling contractor. To get work, during the cash-out re-fi boom, the hardest part was answering all the demand. There was so much work that a contractor could pick up job after job with out much extra effort. The result is that these verticals did not move spend to interactive as quickly as others. The reason: too much work and no reason to change. Now that is over.
When things are going well, people tend to do the same things the same way as yesterday. In the case of the hypothetical kitchen remodeler, it kept advertising in the same places during the boom. According to psychologists, there is certain predictability to such behavior. When the environment changes radically (e.g., the economy falls off the cliff), people change their behavior and start to act differently. In a couple of quarters we’ll know for sure if this is the case here when we update Q3 and Q4 numbers across media.
Next week, Kelsey clients will get to see data at BIA/Kelsey’s Orlando conference that showwhere SMB spend is going based on more recent research (completed last month). Guess where?
Net/net: We expect interactive advertising to start to gain momentum over the next year as advertisers reevaluate their spending behaviors.The following is a financial summary of the Q2 ad market across media.
1Q and 2Q Results
Using major publicly traded media companies as proxies for the media industry as a whole, we see there was an overall reduction in advertising revenues in the first quarter of 2009 compared with a year ago. Radio groups were the hardest hit with a 22 percent fall, followed by television with an 18.6 percent decline, and newspapers with a 15 percent decline. In Q2, radio groups were down 20.6 percent, television declined 20.4 percent and newspapers decreased 7.5 percent.
Radio and television ad spending typically see a bump in the second and fourth quarters, as was the case in second-quarter 2009. While some ad revenues lifted in the second quarter, the numbers were still far below the same period in 2008. Radio and television saw the largest declines: 20.6 percent and 20.4 percent, respectively.
The Internet Results
Over the past 18 months, the Internet category overall has held up fairly well, and is virtually unchanged, as can be seen in the chart below. Television and radio revenues, on the other hand, have dropped precipitously. As we have stated previously, when spending returns, interactive will disproportionately benefit.
Quarterly Revenues Index of Publicly Traded Media Companies
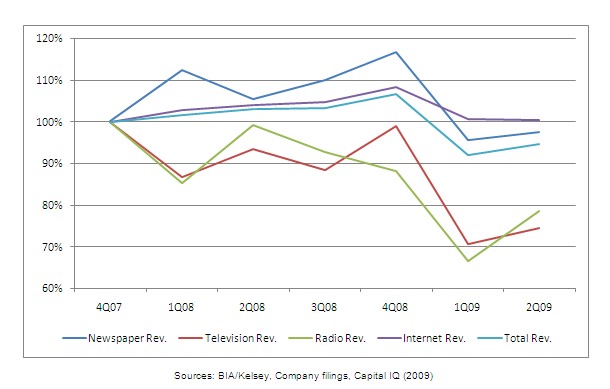
Sources: BIA/Kelsey, Company filings, Capital IQ (2009)
In the second quarter of 2009, the Internet category shrank 3.4 percent relative to the same time last year. However, there are signs of deceleration in the slide down. From the first quarter to the second, the decrease was only 0.2 percent, compared with 7 percent from fourth-quarter 2008 to first-quarter 2009.
This Post Has 0 Comments